A Stubborn Ceiling Keeps Bitcoin in Check
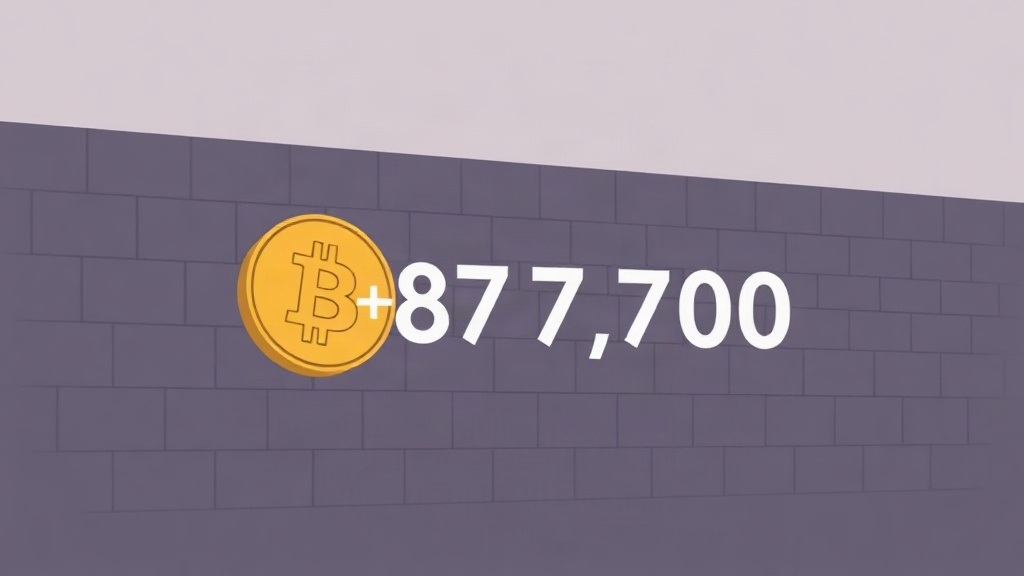
Bitcoin is trading at $83,495 as of October 21, 2026 — up 2.5% on the day but still roughly 5% below a price level that has repelled every serious rally attempt in recent weeks [1]. That ceiling sits at approximately $87,700, and it is not arbitrary: according to Glassnode data on Bitcoin's cost basis, that figure represents the average purchase price of a large cohort of recent buyers who have been sitting on losses for weeks [2].
Three separate rallies have stalled just beneath that mark. Bitcoin peaked at $87,397 on September 21, $87,283 on September 23, and $87,249 on October 2, closing lower each time [1]. The pattern has focused trader attention on a single behavioral question: when the price finally climbs back to their entry point, will those underwater holders sell to recover their losses — or hold on for more?
What the Cost Basis Signal Actually Measures
The cost basis metric, as calculated by Glassnode, works by examining the price at which coins last moved on the blockchain and averaging that figure across a defined group of holders [2]. Traders treat it as a resistance indicator rooted in investor psychology: buyers who have been "underwater" for an extended period often sell the moment they return to break-even, generating a wave of supply that can arrest a rally.
The flip side is equally important. If Bitcoin were to break above $87,700 and sustain that level across multiple daily closes, those same holders would shift into profit. Their incentive to sell would diminish, and the former resistance zone could convert into a support floor [1].
But the metric has real limitations. An average conceals a distribution — some recent buyers paid well above $87,700, others well below, meaning selling pressure is likely spread across a broader supply zone rather than concentrated at a single price point [2]. More structurally, the on-chain model misses a significant portion of actual trading activity. Spot ETF shares change hands on stock exchanges, with custodians holding the underlying Bitcoin; those transactions do not register as coin movements on the blockchain and therefore may not be captured in the cost basis estimate [1].
The Wintermute Transfer: Signal or Noise?
A recent large-wallet movement illustrates how difficult on-chain interpretation can be. Lookonchain reported that three newly created wallets received 1,090 BTC — worth approximately $90.4 million — transferred from Wintermute, a crypto market maker known for handling large client trades [2].
On the surface, the transaction could suggest a private buyer accumulating Bitcoin, implying fresh demand. Equally, it could reflect a custody switch or Wintermute simply reallocating its own inventory [1]. The blockchain records the movement but reveals nothing about ownership or intent. Treating it as confirmed buying demand would be a stretch the data does not support.
ETF Flows: A Cleaner Signal, But Still Inconclusive
Spot Bitcoin ETF flows offer a more direct window into institutional appetite than on-chain data, and the recent picture is mixed. According to SoSoValue, ETFs recorded a substantial $526.6 million inflow on October 19, only to see that figure collapse to $23.2 million the following day [1]. Those figures followed notable outflows of $487.1 million on October 7 and $261.5 million on October 14, even as total net assets across spot Bitcoin ETFs reached $106.3 billion by October 20 [2].
The most telling data point may be from September 21, when ETFs recorded their largest single-day inflow of the past month — $999 million — and Bitcoin still failed to break through. The price touched $87,397 that day but closed at $86,595, still below the resistance zone [1]. If nearly a billion dollars of fresh institutional demand could not push Bitcoin through, the bar for a sustained breakout appears high.
Volatility and the Macro Calendar
One factor that could shift the equation is time. K33 reports that Bitcoin's 28-day volatility has dropped to just 1.2%, approaching the year's lowest levels [2]. Historically, extended periods of compressed volatility tend to precede sharp moves — though they offer no directional signal on their own.
K33 expects volatility to pick up ahead of two near-term catalysts: the Federal Reserve's next rate decision and the November 3 midterm elections [1]. The Fed has held its upper policy rate at 4.00% since September 17, and any shift in that stance — or even a hawkish tone in the accompanying statement — could ripple through risk assets including Bitcoin [2].
Technically, Bitcoin's position is neither alarming nor encouraging. It trades above its 50-day moving average of $81,567 but slightly below its 20-day average of $83,210 [1]. Year-to-date, it is down 5.1% and sits 33.9% below its all-time high, having declined 0.7% so far in October [2].
What Would Actually Change the Picture
Despite the 27.7% rally Bitcoin has staged over the past 90 days, the $87,700 zone has held firm as a ceiling [1]. The analysis in both sources points to two conditions that would need to be met simultaneously to flip the dynamic: several consecutive sessions of ETF inflows at or above the $526.6 million level seen on October 19, and multiple daily closes above $87,700 [2]. Meeting both thresholds would signal that demand is absorbing the break-even selling rather than being overwhelmed by it.
Failure to clear that bar carries its own consequence. A rejection at $87,700 could push Bitcoin back toward its 50-day moving average of $81,567 — roughly 2.3% below where it trades today [1].
What to Watch Next
The next few weeks present a concentrated set of tests. Traders should monitor daily ETF flow data from SoSoValue for signs of sustained institutional commitment, watch whether Bitcoin can post consecutive closes above $87,700, and track any shift in Fed language ahead of the next rate decision. The November 3 midterms add a further layer of macro uncertainty that K33 believes will end the current stretch of unusually low volatility [2]. How Bitcoin navigates that combination will likely determine whether $87,700 becomes the floor of the next leg up — or the ceiling that defines a longer consolidation.


